ADATALAPÚ TÁRGYAK / ÉRZÉKENYÍTÉS A BALATON ÖKOLÓGIÁJÁRÓL
In my diploma project I am reflecting on the current overuse of the Balaton shore through a data-based, dysfunctional tableware. I aim to make the extent of human interventions in the area visually meaningful and tangible with data physicalisation methodology. It provides the scientific grounding for the work, which I have combined with individual narratives to sensitise.
With this project I would like to draw attention to the fragility of our wider environment, the biosphere, and to emphasize the urge to transcend our anthropocentric worldview too.
Mestermunkámban a Balaton-part jelenkori túlhasználatára reflektálok egy adatalapú, diszfunkcionális étkészlet által. Arra törekedtem, hogy a területet érintő emberi beavatkozások mértékét vizuálisan értelmezhetővé és kézzelfoghatóvá tegyem, melyhez az adatfizikalizációs módszertan adja a tudományos megalapozottságot. Ezt az érzékenyítés érdekében egyéni narratívákkal ötvöztem.
A tárgyegyüttessel egyúttal tágabb környezetünk, a bioszféra törékenységére, valamint emberközpontú világnézetünk meghaladására is szeretném felhívni a figyelmet.
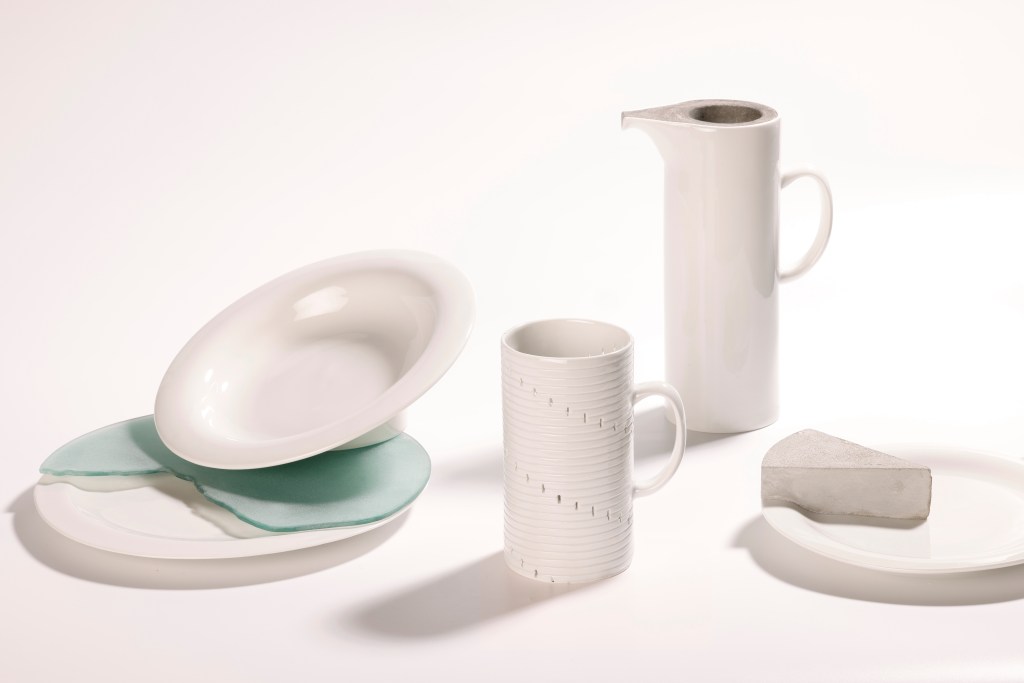
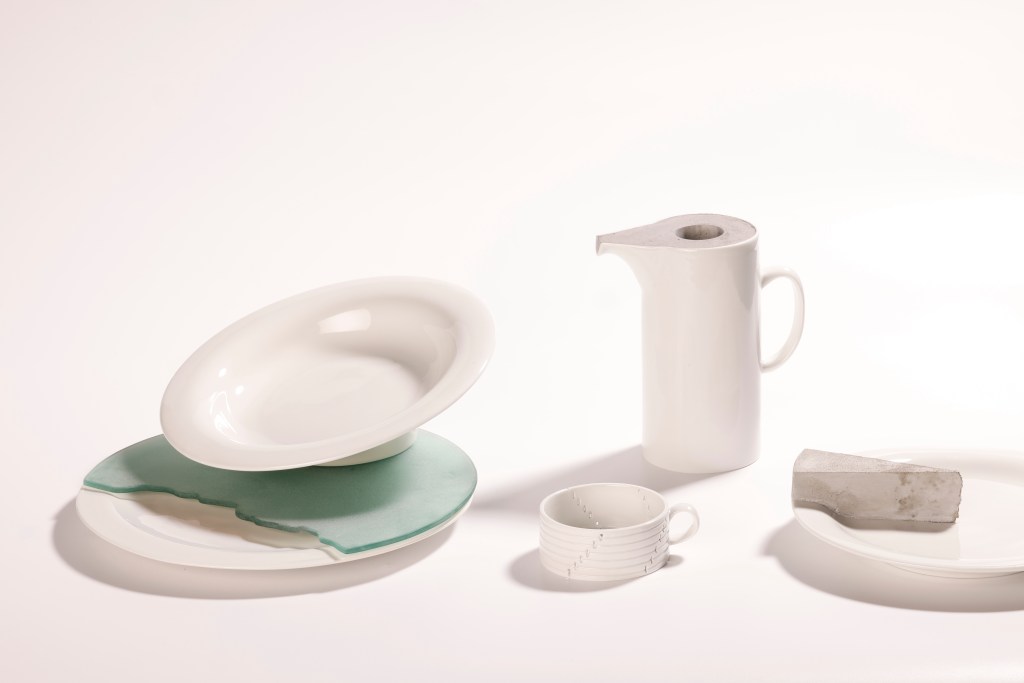
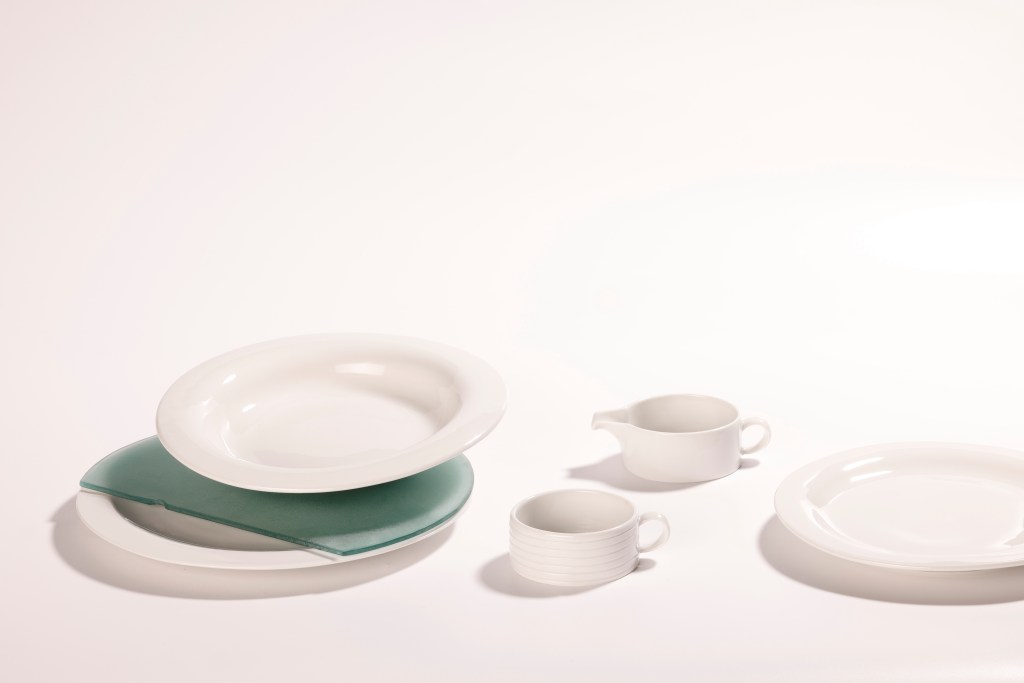
Fifteen objects will be shown below. Three sets of tablewares, each consisting of five pieces: a mug, a jug, a deep-, a flat- and a dessert plate. Identical object types embody identical ecological processes. Each set represents the human interventions and the ecological state of a particular settlement on the shores of Lake Balaton.
These are:
- artificial (concrete) shores (jug),
- the length of reed beds and the number of total cuts (mug),
- erosion of sloping agricultural land (deep plate),
- sedimentation (flat plate)
- and built-up areas in the ancient Lake Balaton area (cake plate).
Az alábbiakban tizenöt tárgy lesz látható. Három teríték, mindegyik öt-öt tárgyból áll: bögre, kancsó, mélytál, lapos- és süteményes tányér. Azonos tárgytípusok azonos ökológiai folyamatokat testesítenek meg. Minden teríték egy adott Balaton-parti településen lezajlott emberi beavatkozásokat és az általuk beállt ökológiai állapotot mutatja be. Ezek
- a nádasok hossza és átvágásainak száma (bögre),
- a partmenti kőszórás (kancsó),
- a lejtős mezőgazdasági területek eróziója (mélytál),
- a mederfeltöltődés (lapostányér)
- és a beépítettség az Ős-Balaton területén (süteményestányér).
The platters presented are based on data from Badacsonytomaj, Balatonfüred and Aszófő.
The choice was justified by the data collected from the above five areas, as I aimed to show as much variation as possible in the physicalizations, despite the few examples presented.B
A bemutatott terítékek Badacsonytomaj, Balatonfüred és Aszófő adatai alapján készültek.
A választást a fenti öt területről gyűjtött adatok indokolták, ugyanis arra törekedtem, hogy a fizikalizációkban minél nagyobb szórás legyen látható a kevés bemutatott példa ellenére is.
About the data physicalization methodology / Az adatfizikalizációs módszertanról
MUGS
The mugs show the total length of the reed beds of a coastal municipality and the number and average distance of the cuts through them. Their diameter is the same as the standard cylindrical cups, 7.9 mm.
The height (i.e. the length of the reed) is determined by a spiral wound on the cylinder. The length of the spiral is on a scale of 1:1000 with the measured length of the reeds of the settlement. The pitch is 5 mm for each cup. The differences in the reed beds of each municipality are differentiated by the height of the cups, so that allows us to compare the extent of the reed beds of each municipalities.
Source of data: Pomogyi, Piroska. 2010-11. The role of direct human interventions in the vegetation changes of the natural areas of the Balaton coastal zone
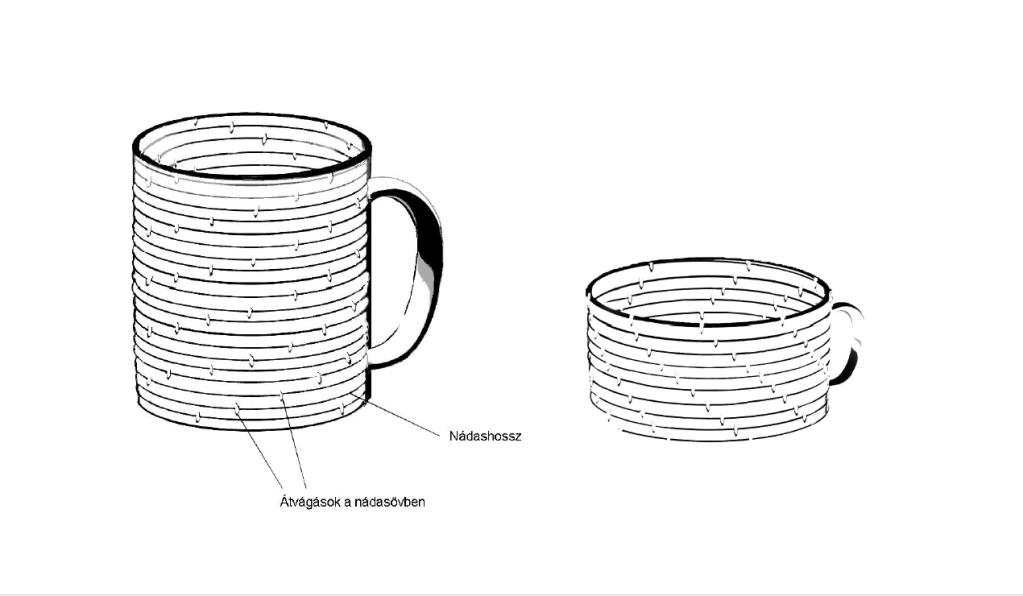
BÖGRÉK
A bögrék egy-egy partmenti település nádasainak teljes hosszát és az azokon ejtett átvágások számát illetve átlagos távolságát jelenítik meg. Átmérőjük egyforma, a sorozatgyártott henger alakú bögrékhez hasonlóan 7,9 mm.
A magasságot (vagyis a település nádashosszát) egy, a hengerre feltekert spirál szabja meg. A spirál hossza 1:1000 méretarányú a település nádasainak mért hosszával. A menetemelkedés minden bögre esetében 5 mm. Az egyes települések nádasaiban mért különbségek a bögrék magasságában differenciáltak, így ismerve a terítékekhez tartozó településeket, össze tudjuk hasonlítani azok nádasainak kiterjedését.
Az adatok forrása: Pomogyi, Piroska. 2010-11. A közvetlen emberi beavatkozások szerepe a Balaton parti sáv természeti területei növényzetének változásaiban
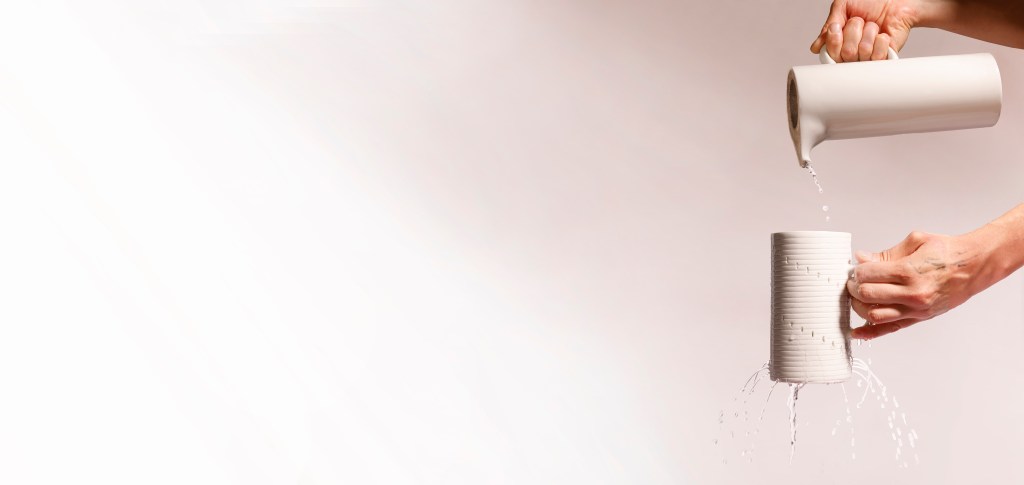
JUGS
The jugs represent the total shoreline lengths of specific settlements and the lengths of artificial shorelines (rocks and/or concrete) along them. Their diameters are the same as those of the mugs and their heights vary from one municipality to another according to the same 1:1000 scale as the mugs, except that the spiral is only part of the design and not the finished object.
Again, the data for each municipality can be easily compared: the higher the jug
the longer the total shoreline, i.e. the total length of the municipality in contact with Lake Balaton. The ratio of jugs to mugs within each set can also be compared. The data physicalisation type for jug-cup pairs is therefore the 3D bar chart.
I wanted to emphasize the extent of the artificial shoreline more. To visualise this, I have used the volume of the pitchers. The proportion of artificial shoreline to the total length of the shoreline of a given municipality is the proportion in which I have poured concrete into the jugs. I have done it in a way so that these proportions are visible from above, and the shape is therefore a kind of cylindrical ring.
The two extreme values, zero percent, would mean a jug without concrete (as in the case of Aszófő), and 100 percent would mean a jug poured solid with concrete. The values in between are concrete cylinder “shells” with different wall thicknesses and different diameters of useful volumes.
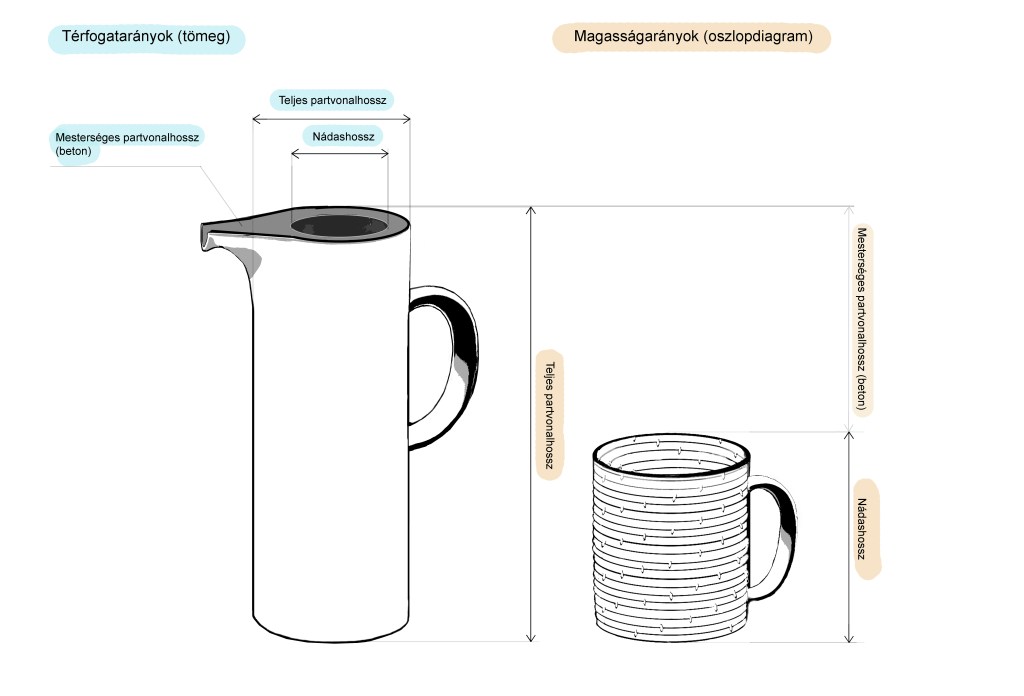
KANCSÓK
A kancsók adott települések jogi partvonalhosszát és az azok mentén mért, nem természetes partszakaszok (kőszórások, betonnal elválasztott parti sávok) hosszát jelenítik meg. Átmérőjük a bögrékével azonos, magasságuk pedig a bögréknél is alkalmazott 1:1000 léptékváltás szerint változik településenként, annyi különbséggel, hogy a spirál esetükben csak a tervezés részét képezi, és nem a kész tárgyét.
Az egyes települések adatait ez esetben is könnyedén összevethetjük: minél magasabb
a kancsó, annál hosszabb a jogi partvonal, vagyis a település Balatonnal érintkező teljes hossza. Az egyes terítékeken belül a kancsók bögrékhez (vagyis a nádasok hosszához) viszonyított aránya is összehasonlítható. A kancsó-bögre párok adatfizikalzációs típusa tehát a térbeli oszlopdiagram.
Szerettem volna kihangsúlyozni ezutóbbiak kiterjedését az egyes települések teljes partszakaszához képest. Ennek megjelenítésére a kancsók térfogatát használtam.
Amilyen arányban található mesterséges partszakasz az adott település teljes partszakaszának hosszában, olyan arányban öntöttem betont a kancsóba úgy, hogy ezek az arányok felülről is láthatóak, ezért a forma egyfajta hengerpalást, egy változó falvastagságú “gyűrű”.
A két szélső érték, vagyis a nulla százalék egy beton nélküli kancsót jelentene (ahogyan Aszófő esetében), a száz százalékos pedig egy betonnal tömörre öntött kancsót. A kettő közötti értékek pedig különböző falvastagságú betonhenger „palástokat” és különböző átmérőjű hasznos térfogatot eredményeztek. A beton diszfunkciója tehát a kancsó hasznos térfogatának lecsökkentése, tömegének megnövelése és a kiöntés megnehezítése.
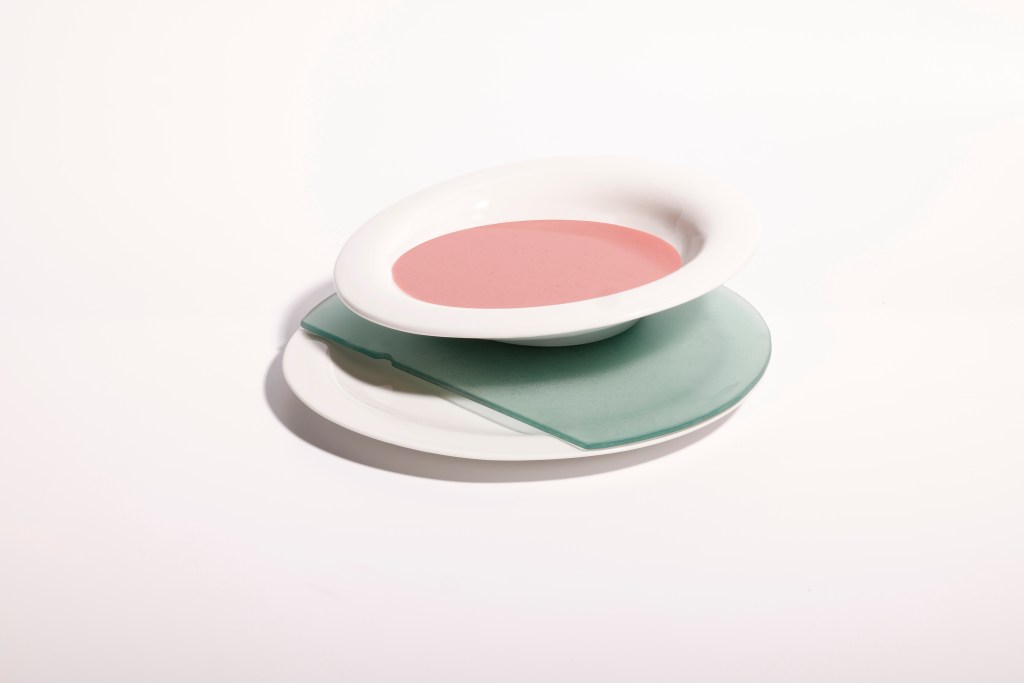
DEEP PLATES
The deep (or soup) bowls show the erosion of the sloping agricultural areas of Lake Balaton. The data were exported using Google Earth software and compared with Copernicus land use satellite maps. The resulting slope percentages were then converted into degrees and imported in the Rhinoceros program.
MÉLYTÁLAK
A mély- (vagy leveses) tálak a Balaton lejtős mezőgazdasági területeinek erózióját mutatják be. Az adatokat a Google Earth szoftver segítségével exportáltam, összevetve a Copernicus tájhasználati műholdképeivel. A kapott lejtések százalékos értékeit ezután fokokká konvertáltam, majd megrajzoltam a Rhinoceros programban.
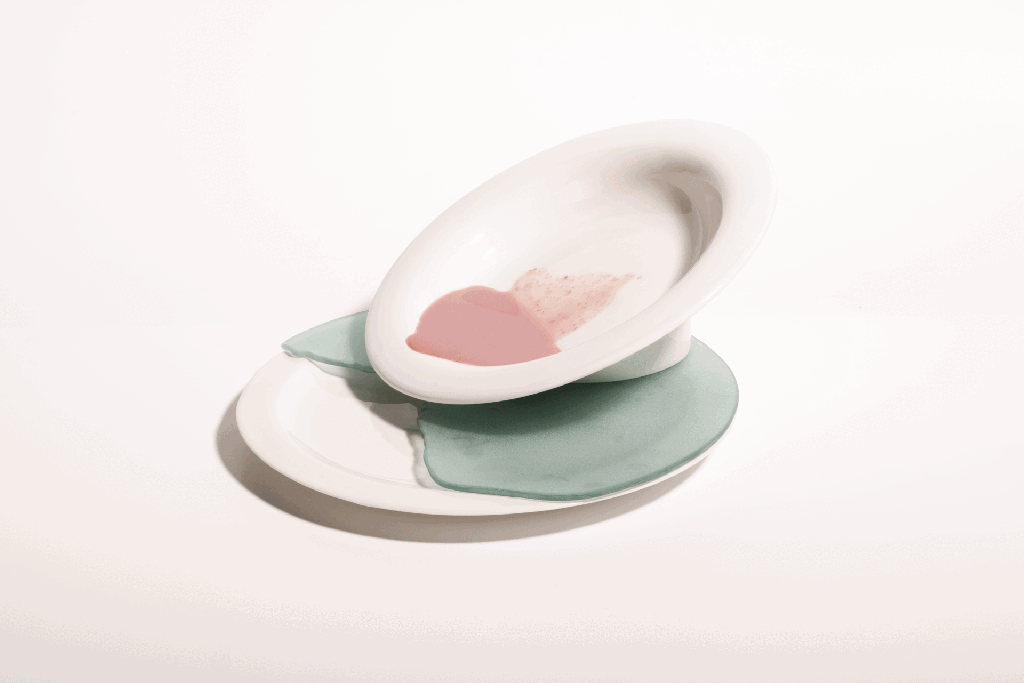
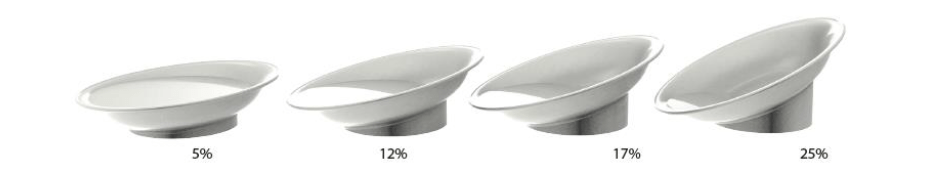
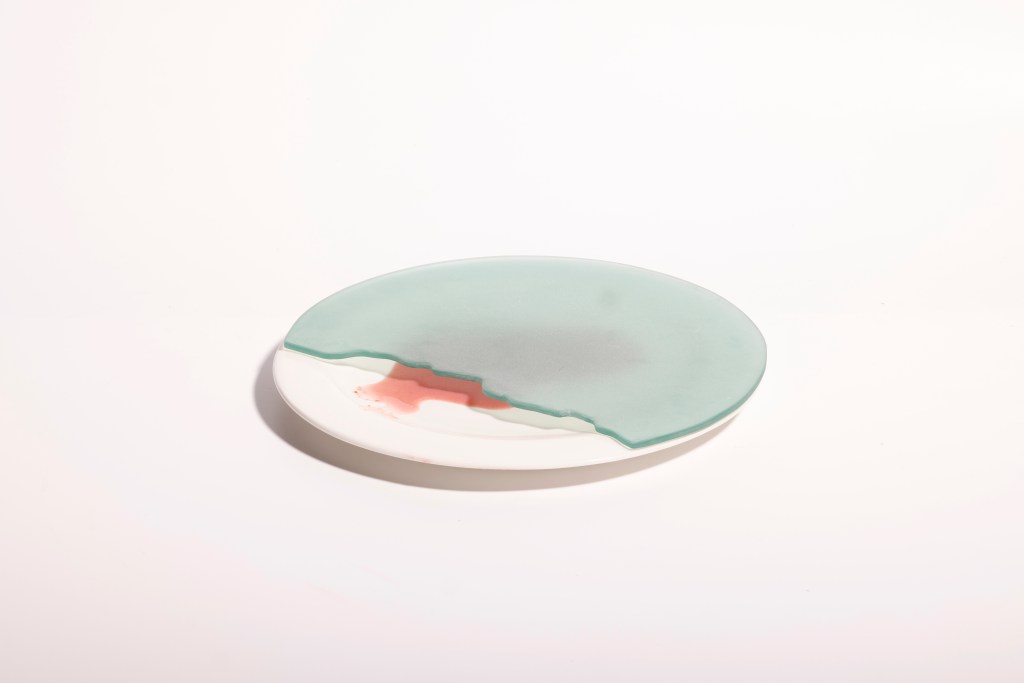
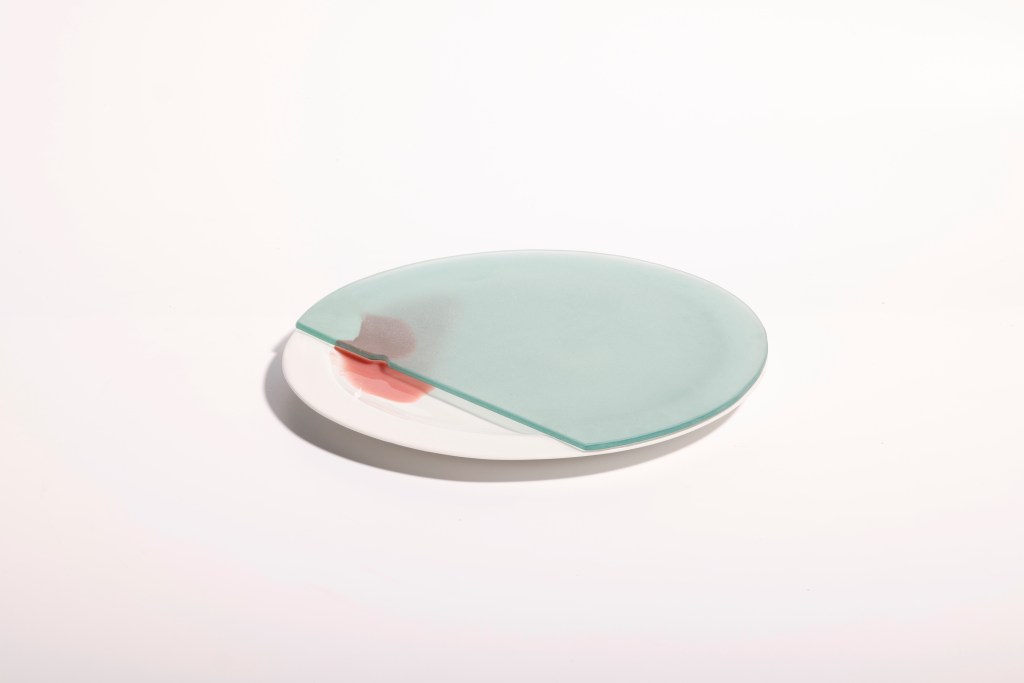
FLAT PLATES
The flat plates are expressing sedimentation, i.e. the deposition of silt and the shoreline of the settlements. Sedimentation- is a consequence of erosion, so I have tried to show this relationship within the pair of objects. Since the soup plate is most often placed on the plate when it is served, it was almost self-evident that this relationship would bring the geographic process to life on the ‘dining table’.
The negative ecological impact of organic matter entering Lake Balaton is expressed in terms of the dysfunction of inaccessibility. The surface of the water is provided by a green flat glass – fixed on top of the plate – which does not completely cover it. The colour of the glass is reminiscent of Lake Balaton, and the drawings show the shorelines of the respective settlements at a scale of 1:22400. The “gap” is therefore the land, through which the “nutrients” of the sloping agricultural areas (i.e. the slant soup plates) can flow under the glass (i.e. the water). The steeper the slope, the more runs off, as in the case of intensively cultivated sloping areas. In these areas, the continuous replenishment of nutrients in a negative spiral exacerbates the problem.
With this piece, I would like to draw attention not only to the specific problem, but also to the common and general phenomenon where, instead of banning human interventions that damage ecosystems, new technologies are developed that cause new problems – and so on. This gives me a sense of the futility that I have expressed with the metaphor of inaccessible food.
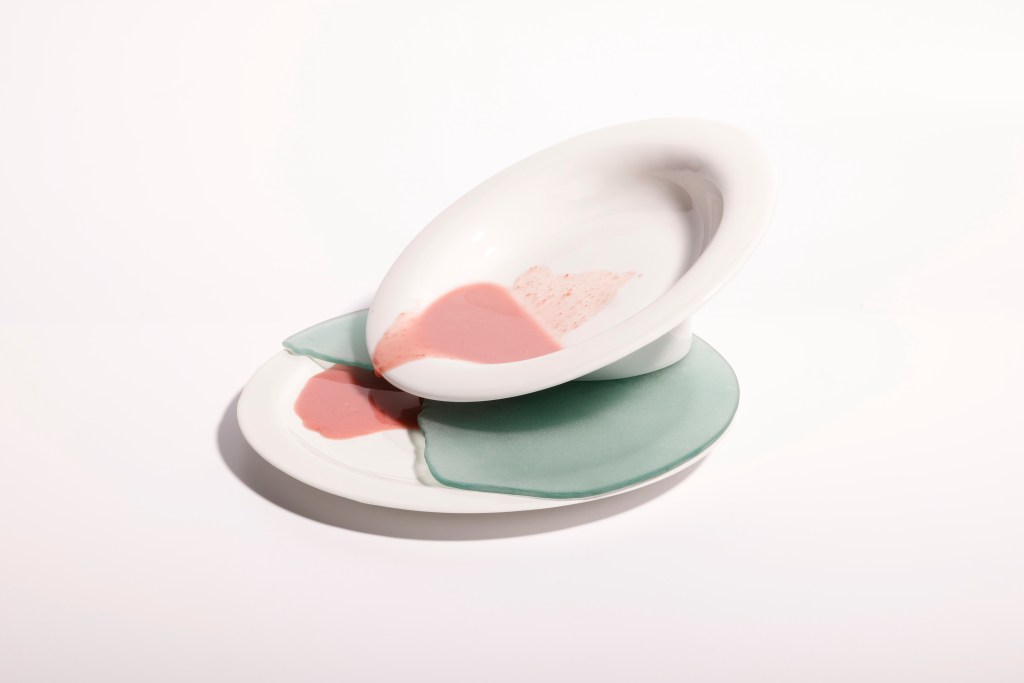
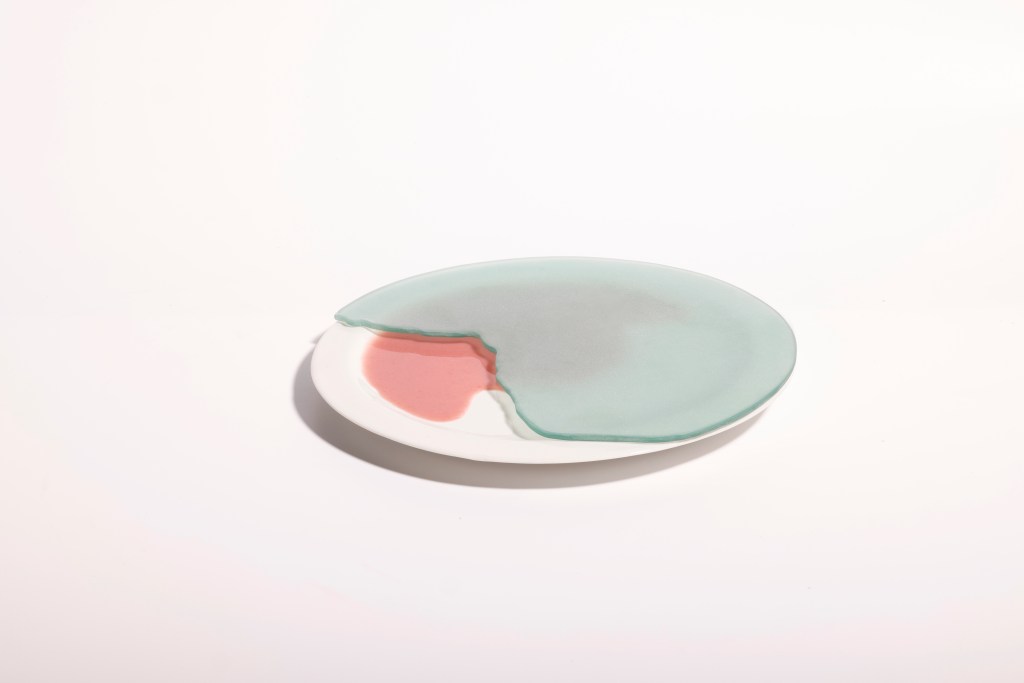
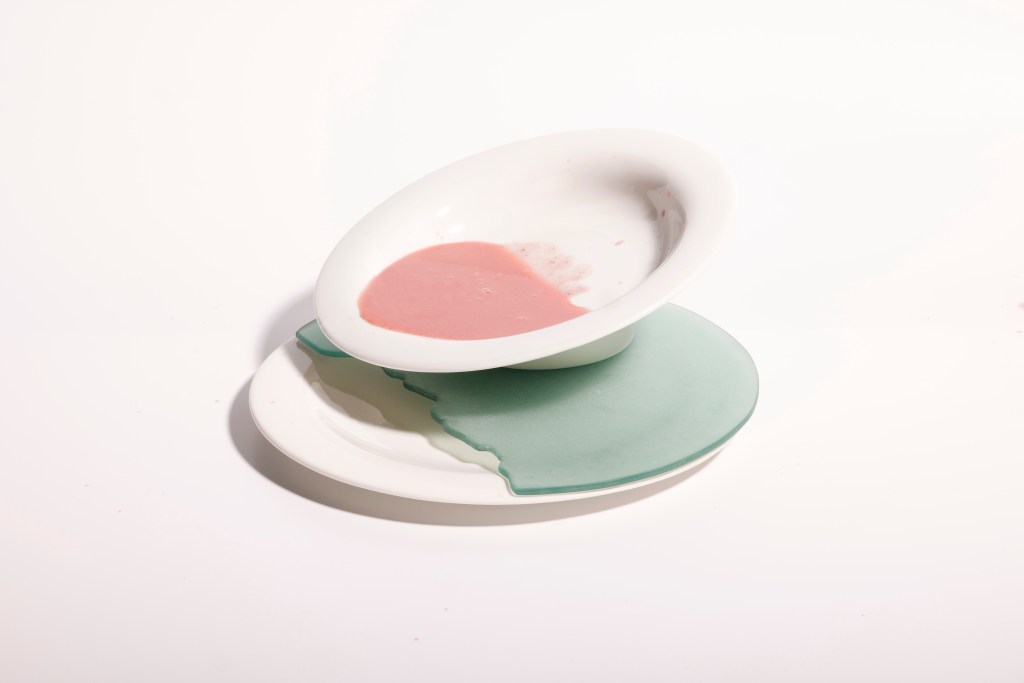
LAPOSTÁNYÉROK
A lapostányérok a mederfeltöltődést, vagyis a Balatonba lerakódó iszapot és
a települések partvonal-rajzolatát ábrázolják. A mederfeltöltődés az erózió következménye, ezért arra törekedtem, hogy a terítéken belül is megjelenjen ez a viszonyrendszer. Mivel tálaláskor a levesestányért leggyakrabban a lapostányérra helyezzük, szinte magától értetődően adódott, hogy ez a kapcsolat hívja életre a geográfiai folyamatot az „étkezőasztalon”.
A Balatonba jutó szervesanyag negatív ökológiai hatását a hozzáférhetetlenség diszfunkciójával fejeztem ki. A víz felszínét egy – a tányér tetejére rögzített – zöld síküveg adja, amely nem fedi be teljesen azt. Az üveg színe a Balatonra emlékeztet, a rajzolatok pedig az adott települések partvonalait mutatják 1:22400 léptékben. A „hiány” tehát a szárazföld, ezen keresztül tud az üveg, vagyis a víz alá folyni a ferde levesestálakból a lejtős területek talajainak „tápanyaga”. Minél meredekebb a mélytál, annál több folyik le, ahogyan az intenzíven művelt lejtős területek esetében is. Ezeken a területeken a kieső tápanyag folyamatos utánpótlása negatív spirálban tovább fokozza a problémát.
Ezzel a tárggyal a konkrét problémán túl arra a gyakori és általános jelenségre is szeretném felhívni a figyelmet, ahogyan az ökoszisztémában kárt okozó emberi beavatkozások tilalma helyett újabb technológiák kerülnek fejlesztésre, amelyek újabb problémákat okoznak – és így tovább. Ez számomra a hiábavalóság érzetét adja, melyet a hozzáférhetetlen étel metaforájával fejeztem ki.
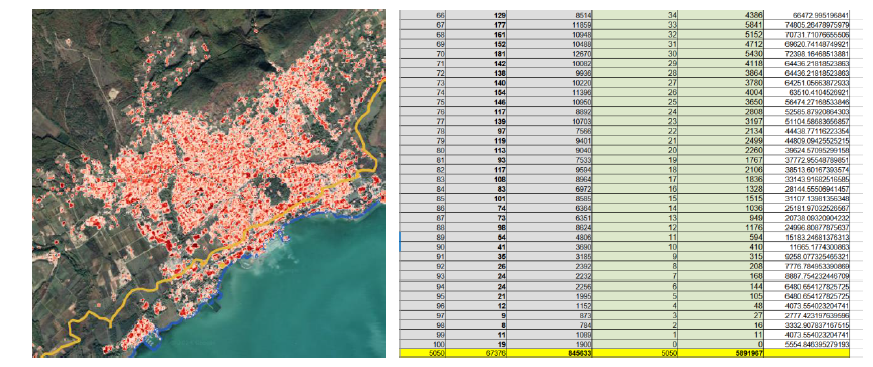
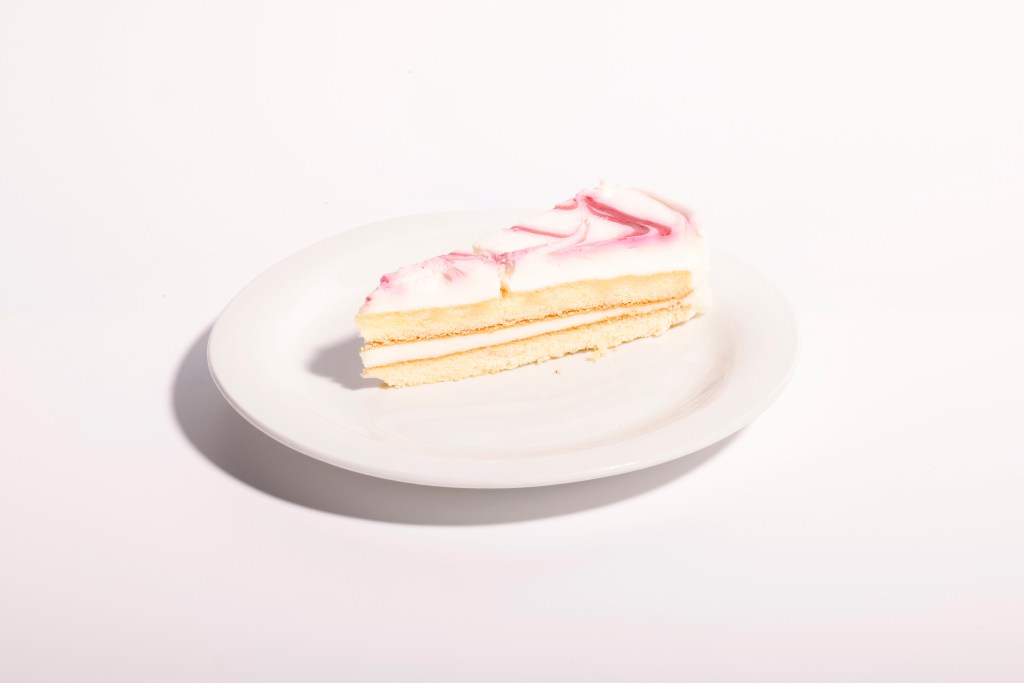
CAKE PLATES
The cake plates show the urban expansion (the percentage of the built-up surface) at ancient Lake Balaton area. The ancient Lake Balaton is a much larger area than today’s Lake Balaton, its boundary being the historical maximum of the lake’s water level fluctuation, 113 mAf (in metres above the Adriatic Sea). With the gradual shrinking of the natural coastal zone and the separation of the lake from the mainland, construction has become possible in areas of high biodiversity that were previously marshy but ecologically supportive of Balaton. Experts believe that this area should be “returned” to Lake Balaton to ensure the survival of the ecosystem.
The source of data is the GHSL layer from the Copernicus 2015 satellite image. A 10 x 10 meter raster was used, which resulted in accurate data, and was visualized in QGIS software with the help of data visualization experts Attila Bátory and Mihály Minkó. The data were exported from the ancient Lake Balaton area of the given municipality, from which the percentage of coverage was calculated using a table.
The calculated percentages were as I expected, giving values between 0 and 12% for the calculated areas. I visualized these in the form of 3D pie charts, for which I converted the percentages into degrees. The concrete “slices” displayed resemble slices of cake, but in reality would be distracting objects that would make it difficult to eat off.
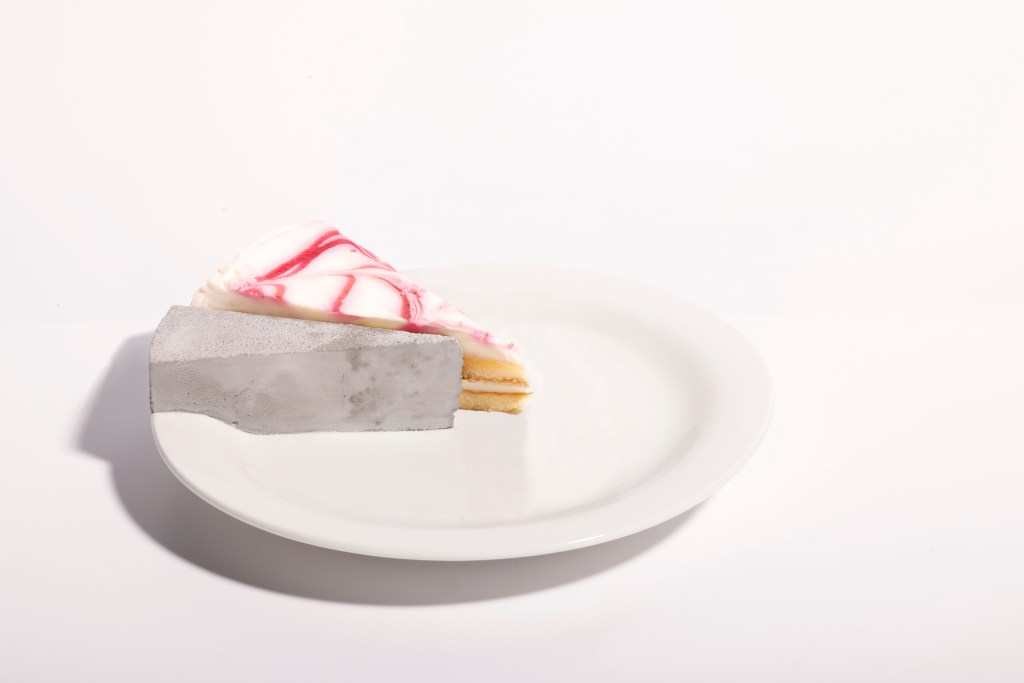
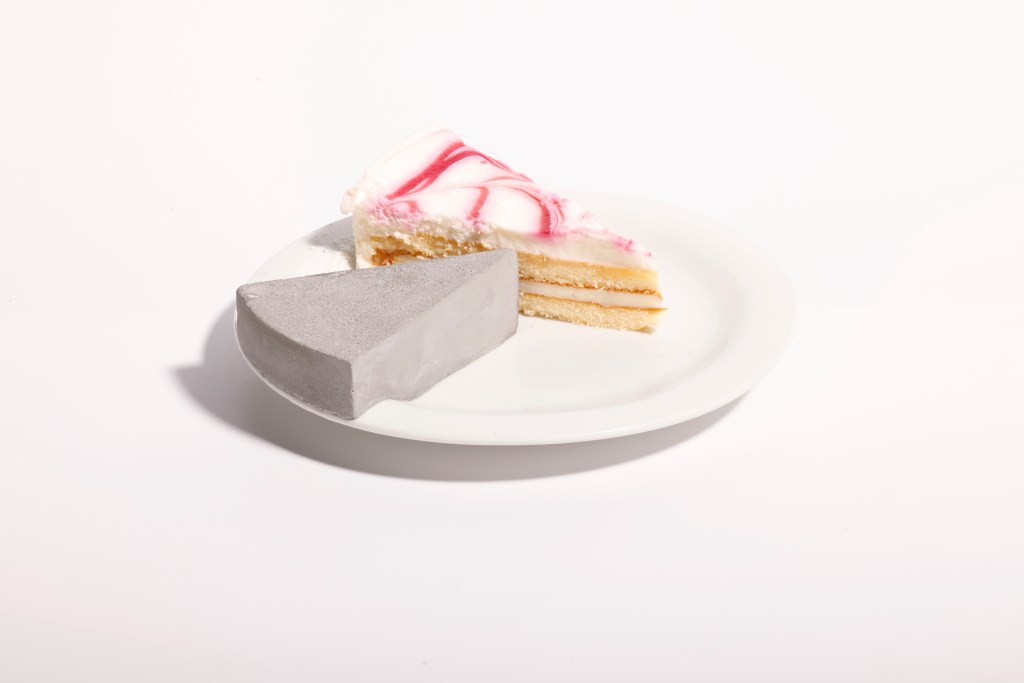
SÜTEMÉNYES TÁNYÉROK
A süteményes tányérok az Ős-Balaton beépítettségét mutatják. Az Ős-Balaton a mai Balatonnál egy jóval nagyobb terület, határát a tó vízszintingadozásának történelmi maximuma, a 113 mAf (Adria feletti magasság méterben) adja. A természetes parti zóna fokozatos zsugorodásával és a tó szárazföldtől való elválasztásával az építkezés lehetővé vált a korábban mocsaras, ámde ökológiailag a Balatont támogató, nagy biodiverzitású terüle-teken. Szakemberek szerint ezt a területet lenne érdemes „visszaadni” a Balatonnak, hogy az ökoszisztéma életben maradását biztosítsuk.
Az adatok forrása a Copernicus 2015-ös műholdfelvételének GHSL rétege. Ez a térinfor-matikai fedvény színek szerint ábrázolja a rajta lévő épületek általi befedettség értékeit. A 10 x 10 méteres rasztert alkalmaztuk, ami pontos adatokat eredményezett, ezt jelení-tettük meg Bátory Attila és Minkó Mihály adatvizualizációs szakemberek segítségével a QGIS szoftverben. Az adott település Ős-Balaton területéről exportáltuk ki az adatokat, amelyből táblázat segítségével számoltam ki a befedettség százalékos értékét.
A kiszámított százalékos értékek a várakozásomnak megfelelőek voltak, a kiszámolt területek vonatkozásában 0 és 12 % közötti értékeket adtak. Ezeket kördiagram formában ábrázoltam, melyhez fokokká számoltam át a százalékokat. A megjelenített beton „szeletek” tortaszeletekre emlékeztetnek, ám a valóságban zavaró objektumokként nehezítenék azok elfogyasztását a tányérokról.
A short film on the use of objects / Rövidfilm a használatról
Acknowledgment / Köszönetnyilvánítás
I would like to thank the following people for their contributions to my masterpiece.
András Mohácsi, Mihály Minkó, Zsuzsa Bokor, Mónika Csák, László Márhoffer, Sára Szeredi, Benjamin Balla A., József Kovács, Ferenc Kovács-Nagy, Gergő Káldi, Attila Bátory, Tamás Vig, Olga Kocsi, Ábel Szalontai, Béla Hegyi, András Zlinszky, Piroska Pomogyi, Viktor Tóth, Ferenc Jordán, Balázs Fromm, Richard Usher, István Oravecz, Ádám Krasz, Máté Tóth-Heyn, Balázs Erlauer, Noémi Becsey-Imreh, Fanni Mester, Péter Vargyas, Márk Horváth, János Gyeviki, Anna Sümegh, Viktor Karacs
